Discover why PM2.5 readings alone don't give the full picture of air quality. Learn how tracking sub-micron particle counts can reveal hidden pollution.
PM mass vs particle count: what you need to know
- PM values: Useful for regulatory comparison
- Particle count: Shows how many sub-micron particles are present in real time, revealing short-term fluctuations
Which channels matter
- 0.3 μm: Indicator of sub-micron particle activity
- 0.5 μm: Useful for tracking indoor trends
- 1.0 μm: Reliable for indoor trend data
Use case example 1: manufacturing environments
A factory with welding or cutting operations may have PM2.5 within compliance limits. However, particle counts reveal sub-micron dust spikes during certain shifts, allowing facilities managers to prioritise additional filtration or adjust processes to reduce exposure.
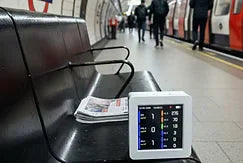
Use case example 2: London Underground
The London Underground is a complex environment with high passenger numbers, frequent train movements, and variable ventilation. While PM2.5 readings might suggest air quality is acceptable, particle counts can reveal spikes in sub-micron particles on platforms, in tunnels, and in ticket halls.
Air quality teams can use this data to:
- Identify persistent hotspots where ventilation or filtration improvements are most needed
- Monitor real-time changes during peak passenger periods or service disruptions
- Evaluate the effectiveness of interventions, such as new filters or air-cleaning technologies
By tracking both PM and particle numbers, transport operators can spot problem areas early, protect workers and passengers, and prioritise where high-precision equipment or filtration is needed.
Share:
Why particle count matters even when PM2.5 looks clean